A simple alternative to MoTeC
MoTeC & Track Titan
MoTeC is a sophisticated and powerful motorsport electronics system that offers extensive data acquisition, analysis, and control capabilities for race cars. However, its complexity can make it challenging for new users to understand and operate it effectively.
One of the main reasons why MoTeC is complicated is due to its vast array of features and functions. It offers an extensive range of sensors, inputs, and outputs that can be customized to suit the specific needs of each vehicle and application. This level of flexibility requires users to have a deep understanding of both the hardware and software components of the system.
That's why Track Titan has made telemetry more user friendly. It offers a more simplified view of the telemetry information a sim racer needs to improve his or her lap times.
Instead of an overwhelming amount of data, Track Titan offers the user the bare necessities to evaluate their driving, and makes it possible to easily compare it to faster drivers, or friends. It allows you to learn from others in the community by showing you exactly what they have done to drive as fast as they have.
You don't need a degree in mechanical engineering to understand Track Titan's user friendly design, which allows you to be your own race engineer.
The Tool
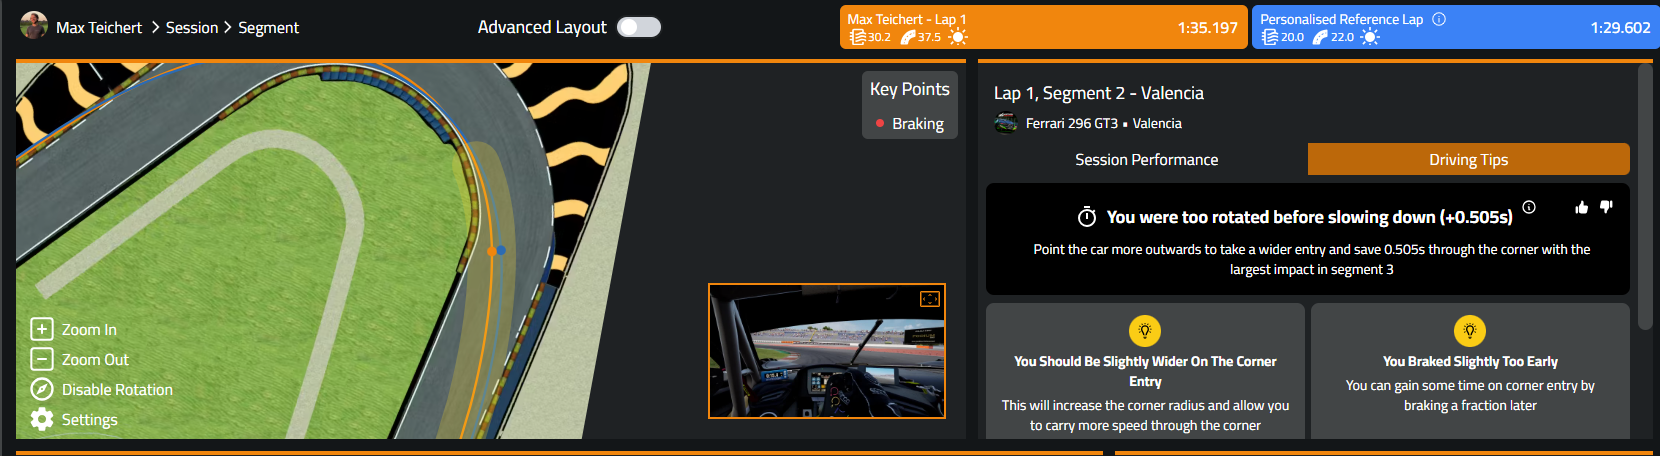
Track Titan gives you the information you need to improve your driving in a simple, and organised manner.
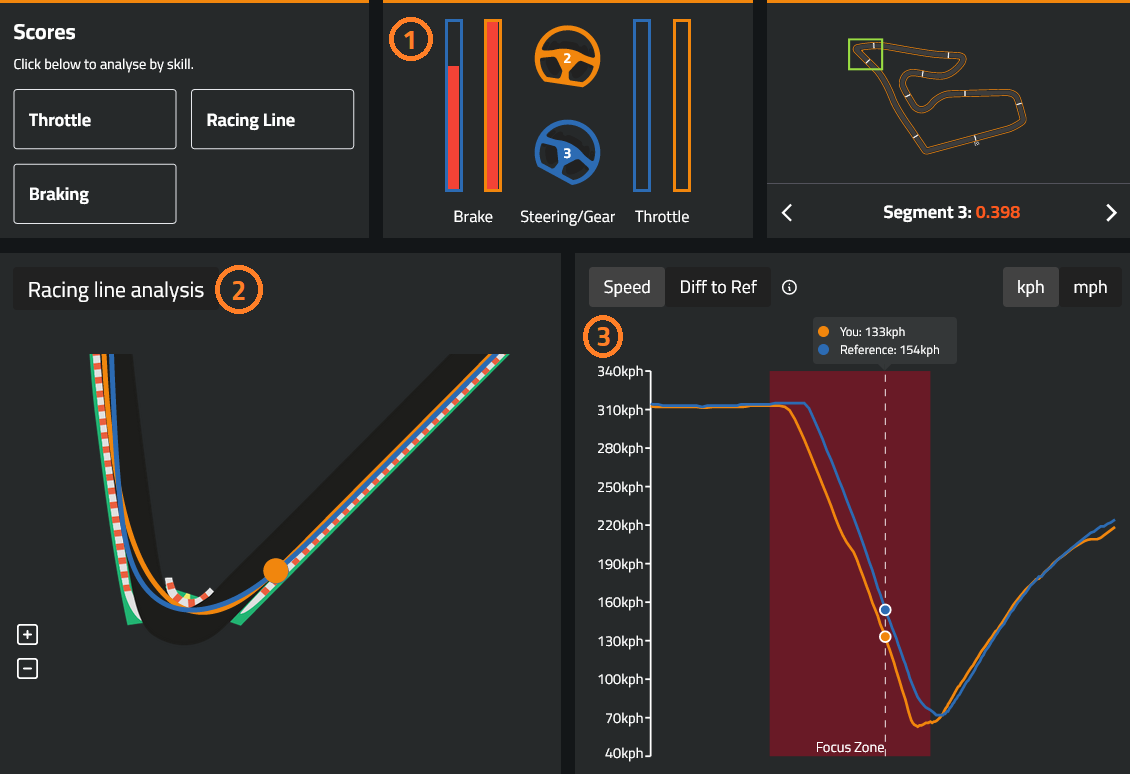
1 - Pedal & Steering inputs
In the part of the screen marked with "1" we can see the pedal and steering inputs of both ourselves and the driver we are comparing ourselves to. We can exactly see what they are doing on the same part of the track as us. This might give us as users a hint to whether or not we are braking too much, steering in enough, and if we're in the correct gear (displayed by the number in the middle of the steering wheel).
2 - The Racing Line
In section 2 we can analyse the difference in racing lines. Our own racing line is shown in orange, and the lap were analysing against is shown in blue. This is a great visual tool to indicate whether or not we are following the right racing line, and we can discover if we can use other racing lines to be faster. It helps you to clearly see if you can use more track space, different turn-in points, etc. which is great for anyone looking to improve their lap times.
3 - The Graphs
In section 3 we find the graphs. Currently the speed graphs is shown, which contains a ton of information in a nicely condensed view. First of all we can find out when we're going too fast, or too slow. We can also see that in this particular example, the orange line starts to drop off earlier than the blue reference lap line, which indicates that we started our braking phase somewhat too early. Then at the bottom of the graph we can also see that we drop down to a lower speed at the apex of the corner than the driver of the reference lap did, which means that we can carry more speed around the apex. The speed chart can give you a ton of information at a glance.
The speed graph is not the only one available, by clicking "Throttle" or "Braking" in the top left of the screen, we can change the graph to show our throttle and braking inputs. This way we can analyse the details of our pedal techniques more accurately when you deem this to be necessary.